Thursday, October 1, 2009

Breaking out of the DWG

Professionally, I’ve always been square on the fence between CAD and GIS. The funny thing is that GIS folks always call me a CAD guy, and the CAD guys always call me a GIS guy. Personally, I’ve always believed in using the right tool for the job, regardless of the technology. The best part for me is that I learn from both technologies and apply them wherever it fits. One of those “learnings” has been to break free from the DWG in AutoCAD Map.

Traditionally, when working in AutoCAD, we work in a drawing. The drawing maintains the model as well as any associated annotation, labeling, details, etc. At most we’ll have a group of drawing files, and some external references to share drawings. It’s much like using Word. We work in documents.

Traditionally, working in a GIS is a bit of a different model. While you have views, or map documents (depending on the particular flavor of GIS) your documents are really little more than a collection of links to data with some instructions on symbolizing the data. It really is more like working in a database, like Access, than in a document.

Both approaches provide benefits, so why not mix them? AutoCAD Map 3D allows me to bridge the gap between technologies. I can use my current drawing file as a pointer to various data sets, while having additional drawing information in my drawing file. For example, I can have my model (the actual drawing representation, whether it be a design of a road, or a city water system) linked from external data sources, and have multiple drawing sheets, complete with one or more title blocks in my current drawing. It allows me to have specific views, sheets or plans with project-specific data and take advantage of permanent data stores that are dynamic and updated each time I open them.


This allows me to use my enterprise GIS as part of my design tools without having to go through a conversion process. The great part is that it doesn’t really matter what my data source is. I can use other drawings through the attach and query tools, as well as Feature Data Objects (FDO) connectors to systems such as ArcSDE, Oracle or MySQL. I’ll blog more on that GIS-Design integration another time. The point being, is that the individual drawing can lose it’s importance and become essentially a snapshot of your model.


When using drawings as your data source, you can either use the ribbon or the Task Pane (as well as the Classic Menus). On the Ribbon, Attach is right on the Data Panel on the Home Ribbon for both task and tool-based workspaces. The Map Explorer tab in the Task Pane provides a visual of the drawings attached – to access the commands right click on drawings.


FDO data sources can be connected using Connect on the Data Panel in the Home Ribbon as well (next door to the Attach commands), or from the data button at the top of the Task Pane.


The short story is that you don’t have to be a slave to your DWG file, and treating your DWG as a view to your model, you have some real power to take advantage of a whole new range of possibilities. The great part is that this is not new technology (the FDO process is relatively recent). Map has incorporated this capability since it was acquired.

So, unleash the shackles and get connected.

Thursday, August 20, 2009

AutoCAD Map Tips and Tricks

Data from the Web

One of the challenges for GIS users is finding data, and another is maintaining that data once you find it. Many times, another organization will have a data set that they are willing to share. Getting a copy of the data and incorporating it into your system is a relatively easy process. When that data is regularly being updated, keeping your copy of the data current is another matter altogether. The challenge is greater as the data is more dynamic.

Web Mapping Services (WMS – shares image data) and Web Feature Services (WFS – shares feature data) are a way to distribute, and receive data over the web. An organization can publish their data to the web into his format and make their data available to other organizations. Then any authorized user with the right tools can have a live connection to that web data. When data is updated, all of the connected users will have those updates as well.

AutoCAD Map 3D can use both of these services to allow the user to connect to these data sets and make them part of their drawings. The great part is that this data is a connection to live data rather than objects stored in the drawing, so they will not require space in the drawing (the other side of that is that the connection to the data must be live to see the data).

To add this data, you right click on the data icon in the Display Manager tab of the Map Task Pane and select “Connect to Data” (this also works in Civil 3D).


This will open the FDO Data Connect palette. Select Add WMS (or WFS) Connection.


The palette will show boxes to add the connection information.


Add a name for the connection, the web address, and the WMS standard version (which is usually part of the address) and select the Connect button.


Once you are connected, you have the option to select which data (image sets or layers) to add to the map. Select the “add to map” button and the data will appear in the drawing and the feature set will show up in the Display manager.


Now, you have a live connection to the data. You can save the drawing file, and the next time you open it, the connection will be reestablished.

This makes a relatively painless way to share GIS data. The user has immediate access to the data, any changes, and can’t modify the data in any way, but can use it as a part of their geographic data.

In addition, the Open Geospatial Consortium, Inc., a non-profit standards organization, maintains a list of some of these public web-enabled data sets. So next time you’re needing some data, check it out. Someone may have posted just what you need.

Tuesday, August 11, 2009

AutoCAD Map Tips

MAPIMPORT – Digging in to DGNs

AutoCAD Map 3D includes some additional tools for importing DGN (as well as other file formats) information into AutoCAD. There is a command called MAPIMPORT (you can reach it from the Map menu in the 2009 and earlier products, or from the Map Workspaces in 2010 – or just type MAPIMPORT). It allows you to import all or part of a DGN file. You will have the option to select the levels you want to import, as well as any attribute information. Furthermore, if you are commonly doing the same type of import, you can save the settings for future use. In your case, with a very large file, you may want to import the DGN in smaller parts by selecting groups of levels in the Input Layer section.

The process works like this – start the MAPIMPORT command. You will get this dialog box:


The top section allows you to manage any coordinate information. This is a way to project the source drawing objects into a new coordinate system.

The Spatial Filter allows you to import drawing objects by selecting an area.

The Saved Profiles section will allow you to modify how AutoCAD will recognize the source drawing objects, such as how to manage cells:


On the initial dialog box, the Input Layer provides a list of the levels present in the DGN file. You can select any or all of the levels you want to import. For large files you want to split up, this is a great way to do that. For Geospatial users building datasets, this is a method to break up the data by thematic groups.


The Drawing layer is the target AutoCAD layer. You can leave it as the Input Layer, select a layer from the drawing, create a new layer, or create a layer based on one of objects’ data fields from the DGN. Just select the ellipsis (…) at the right (click in the layer box to show it).


If you are using Map’s Object Classification tools, you can convert imported objects into classes.
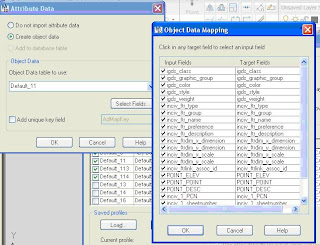
You can also convert the DGN’s data fields into AutoCAD Map Object Data as well, even going so far as to map the specific elements to specific Object Data fields.


At the right of the import properties, you also have some control of how certain insert objects are imported. You can use AutoCAD Points, text (with the value taken from a data field), blocks, and even get attribute values from the data fields.

You can also save this profile you’ve created, so that you can reuse it with other DGNs from the same organization (provided they use consistent standards).

You can learn all about the tool by starting the command, and clicking the help button on the dialog box. That will take you right to that section of the helps which will explain the tool.

Try it out – it’s a powerful way to work with outside data sources. Try it with files other than DGNs as well. It could save you some time.

Wednesday, January 28, 2009

Book Review - "The GIS Book" by George Korte

Periodically while presenting at a conference or teaching a class, I'll have people ask me about books on GIS. I have a few favorites that I always recommend, so I'll start adding them here as well.

Periodically while presenting at a conference or teaching a class, I'll have people ask me about books on GIS. I have a few favorites that I always recommend, so I'll start adding them here as well.
The first book I'm reviewing is "The GIS Book" by George Korte. I believe it the most current version is the 5th edition, and is currently published through Delmar Learning, but is available through many retailers, including Amazon.

You can read some of it online through Google Books.

I originally read this in a pre-published version. I attended a workshop with George Korte while he was waiting for the first edition to be published, and he passed out copies bound in plastic combs. I found Mr Korte an excellent presenter, and the material was very good. The book was an expansion of the topic (or maybe the presentation was a contraction of the book?).

What I really like about the book, is it is the best overall coverage of GIS and what GIS is that I've ever read. It is a non-technical description of the technology and its uses. That's right - non technical. It is written in easy to read language and doesn't give a lot of jargon that requires an industry insider. I have foud it useful in various organizations to give this book to managers to help them understand what it is I do/can do. It is the perfect introduction. When I teach classes in introductory GIS, this is one of the books I use as a textbook.

As the years have gone by, Mr Korte has updated it, and even provided a ROI calculator spreadsheet to help determine the value of GIS.

So, if you're looking at a great intro or overview of GIS, by someone who "gets it," check out "The GIS Book."

Here's an interview with the author from GISVision.