This is a reprint from an earlier blog (March 25, 2010) that is no longer online.
The new 2011 version (or is that “oh-eleven”) of AutoCAD Map 3D has some unique new features.
Some are not visible, such as Autodesk reworking the memory usage and making it more efficient, to visible items, such as moving the Group and Display Order toggle to it’s own place on the Task Pane.
The most substantive impact came with the incorporation of the tools to read LIDAR, or point cloud data. Subscription users got a sneak peak at this with the Subscription Advantage Pack (SAP) late last year. I commented on this in my blog right after last year’s AU.
Now the tools to display and work with point clouds are built right into the ribbon, and have been combined into the Data Connect button on the Task Pane (in the SAP, you had to go to the tools button to work with indexes before you could add point cloud data from the Data Connect button).
When I first tried to use the add point cloud data option, I struggled with adding it because I didn’t realize I had to first go to the tool bar to generate an index first. Now it’s a little more intuitive.
One of the primary applications driving the use of Map 3D was the capability to manage projections and coordinate systems. You can establish a coordinate system for your current drawing and bring in drawings or data sets from other coordinate systems and Map 3D will project them into the current drawing’s coordinate system. Along with this is the useful capability to “track” coordinates. The Track tool allows you to identify (or digitize) the location of the cursor in a different coordinate system. For example, I may want to get the latitude and longitude of radio transmitters for a FCC permit, but my mapping data is in a UTM system. I can use the tracking tool to capture the latitude and longitude without having to reproject the data. Likewise, if someone gives me a location from a GPS that is in lat-long and I want to add it to my UTM-based map, I can use the tracking tool to place the point. Well, in 2011, the tracking tool has been expanded to add multiple systems. You cann add additional “trackers” to the dialog box to get several on there as once. This can be really helpful to some of us working in several coordinates all the time (such as UTM, State Plane and Lat-Longs).
One new set of features dosen’t really extend the software, but may make it easier for users to take advantage of the tools. There are a number of new “assistance features.” Right on the startup screen, there are links to videos for several tasks available.
That’s a short list. There’s a number of others, such as the ability to add grids and graticules, better overlay analysis (can handle a significant higher volume of features), and adding more capability to the Workflow tools (you can now add AutoCAD commands to your workflows).
So there’s some great reasons to look forward to making the transition. Not to mention all of the new AutoCAD features – Isaac Harper blogs about them here. See you on the other side!
Wednesday, January 23, 2013
Get Your Head in the Clouds
This is a reprint from an earlier blog (ember 18, 2009) that is no longer available.
Geospatial applications are renowned devourers of information. As new technologies for capturing data are developed, the geospatial applications soon follow. It makes sense as we try to find better and cheaper methods of modeling our world. One of these technologies is LIDAR (Light Detection And Ranging). LIDAR is becoming a common remote sensing technique. It sends out and measures the return of laser pulses to determine distances (as well as other information) in 3 dimensions to essentially generate a 3D view of the scanners environment. The resulting data is a very large group, or cloud of X, Y and Z values (along with other descriptive information depending on the equipment and technique). These point clouds have required specialized software to view and capture information.
Now, subscription AutoCAD Map 3D and Civil 3D users have some new tools available to work with these point clouds. The new Subscription Advantage Packs include tools for viewing and classifying Point Clouds. This can be incredibly useful to geospatial users. At a large private electric utility I used to work for, we used LIDAR as a method to survey electric transmission lines and surrounding vegetation. We were looking for trees that were growing into the lines and cause potential outages.
After installing the new Subscription Advantage packs in AutoCAD Map 3D, some new options become available. In the Task Pane’s Display Manager Tab, there is a new option in the Data menu – “Add Point Cloud Data.” Selecting this option opens a file select dialog prompting for an ISD file – a Point Cloud index, or data store file. You create the index from the new Point Cloud Manager.
Another new option is in the Tools menu – “Create Point Cloud Index.” This option opens the Point Cloud Manager.
From the Point Cloud Manager, we can add LIDAR data files to create a Point Cloud data store, merge them into groups, set coordinate systems, use filters to classify, create elevation ranges and even create spatial filters.

Adding the Point Cloud Data will create an entry in the Display Manager tab, and add a new Point Cloud ribbon giving us tools for stylization, exporting and creating surfaces.

Keep in mind, these data sets are big, and will tax your system resources, so be prepared.
So, get your head in the clouds and check it out. The view is great.
Geospatial applications are renowned devourers of information. As new technologies for capturing data are developed, the geospatial applications soon follow. It makes sense as we try to find better and cheaper methods of modeling our world. One of these technologies is LIDAR (Light Detection And Ranging). LIDAR is becoming a common remote sensing technique. It sends out and measures the return of laser pulses to determine distances (as well as other information) in 3 dimensions to essentially generate a 3D view of the scanners environment. The resulting data is a very large group, or cloud of X, Y and Z values (along with other descriptive information depending on the equipment and technique). These point clouds have required specialized software to view and capture information.
Now, subscription AutoCAD Map 3D and Civil 3D users have some new tools available to work with these point clouds. The new Subscription Advantage Packs include tools for viewing and classifying Point Clouds. This can be incredibly useful to geospatial users. At a large private electric utility I used to work for, we used LIDAR as a method to survey electric transmission lines and surrounding vegetation. We were looking for trees that were growing into the lines and cause potential outages.
From the Point Cloud Manager, we can add LIDAR data files to create a Point Cloud data store, merge them into groups, set coordinate systems, use filters to classify, create elevation ranges and even create spatial filters.

Adding the Point Cloud Data will create an entry in the Display Manager tab, and add a new Point Cloud ribbon giving us tools for stylization, exporting and creating surfaces.

Keep in mind, these data sets are big, and will tax your system resources, so be prepared.
So, get your head in the clouds and check it out. The view is great.
Labels:
Autodesk,
Autodesk University,
Geospatial,
Map 3D,
Mapping,
Tips and Tricks
Wednesday, May 5, 2010
Try Out a Map Book

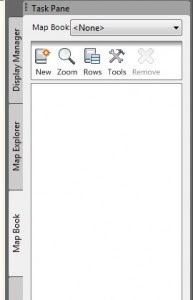
On the Task Pane of AutoCAD Map 3D, there is a series of tabs. I spend a lot of time demonstrating and talking about the first two, but I don’t spend much time on the third one – Map Book. The Map Book tab is simply a set of tools designed to help users generate an easily reproducible set of printed maps. It will generate a standard AutoCAD Sheet Set, but will include some tools specifically designed to simplify setting up a grid-based Sheet Set, complete with a key map and navigation features.
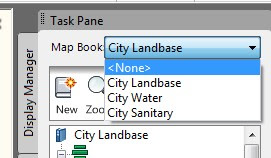
Before creating a new map set, you need to make some decisions. You will need a template drawing file with a layout defined with a title block, and if desired, the adjacent navigation blocks, main, key view and legend viewports. There are a number of templates to use as examples that come with Map. You can find them with the other templates in \Documents and Settings\\Local Settings\Application Data\Autodesk\ AutoCAD Map 3D 2010\R17.2\enu\Templates. These templates may net perfectly suit your specific application, but they can give you some ideas.
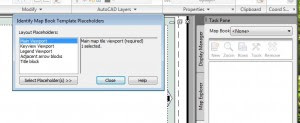
Once you have everything ready, you can use the New button to start a new map book. As with most things Map, you will get a workflow-based dialog box. Go through each section of the dialog before closing the dialog or hitting the generate button.
First, you’ll set a name in the Source. You will select Map Display if you’re plotting objects from the Display Manager (primarily FDO connections) and Model Space if you’re selecting AutoCAD Objects. Remember, you can add Objects from model space into the map display.
Your next step is to select the template drawing file, with the Layout and Title Block you’ve setup. At this point you can add the links to adjacent sheets. You will also set the scale here.
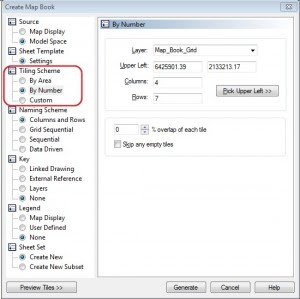
If you want to create an overlap, and still keep scale maps (I’m not sure who wouldn’t), a friend of mine, Jeremiah McKnelly wrote a great tip for getting true scale map books with an overlap. Check it out here.
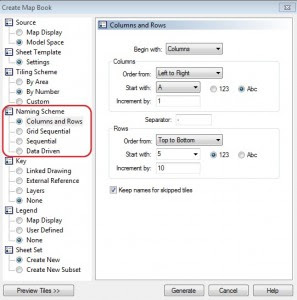
Next you can define your key drawing. You can use premade keys, or generate one on the fly by selecting the layers you want to show.
You can then add a legend where map will setup the viewport if you’ve already created a legend, or you can set up a space to add one later.
Finally, you get to define where you’ll put your sheet set definition file (.DST).
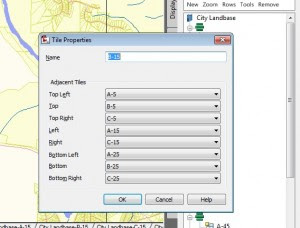
The process allows you to very quickly layout some simple sheet sets with very minimal effort. If your organization needs to plot map books or sets of printed maps, this may be the right tool for
Labels:
AutoCAD Map,
Autodesk,
Mapping,
Tips and Tricks
Subscribe to:
Posts (Atom)